The Essence of the Dashboard Page
A Critical Tool for Data-Driven Decision Making


In today's digital age, where data is abundant and rapidly generated, the ability to effectively interpret and act on information is crucial. This is where the dashboard page comes into play. Acting as a visual representation of real-time data, a dashboard page is an indispensable tool for data-driven decision-making.
At its core, a dashboard page is a user interface that presents key data in an easily digestible format. It consolidates metrics, performance measures, and other relevant information into a single screen. The data can often be customized and organized to suit the user's specific needs, making it a flexible tool that can cater to various roles and industries.
Why Dashboards Matter
Dashboards are crucial for several reasons. First, they provide a quick overview of essential data. Whether it's a business leader checking company performance, a marketing team tracking campaign metrics, or a project manager monitoring project progress, dashboards deliver critical data at a glance.
Dashboards promote data transparency. They make it easy to share information across teams and departments, fostering an environment of open communication and collaboration.
Dashboards facilitate informed decision-making. By displaying data in real time, they help users identify trends, address issues promptly, and make strategic decisions based on up-to-date information.
Key Components of an Effective Dashboard Page
An effective dashboard page should have the following elements:
Relevant Metrics: The data presented should be relevant to the user's role and objectives. Irrelevant data can clutter the dashboard and detract from its effectiveness.
Real-Time Updates: The dashboard should provide the most recent data available, enabling users to make decisions based on the current state of affairs.
User-Friendly Design: The dashboard should be easy to navigate, with a clean and intuitive design. Users should be able to understand the data at a glance, without needing to decipher complex graphs or tables.
Customizability: Users should be able to customize the dashboard to suit their specific needs. This could include adding or removing metrics, changing the layout, or adjusting the timeframe of the data displayed.
Interactivity: A great dashboard allows users to interact with the data. This could involve drilling down into specific metrics for more detail or adjusting variables to see different scenarios.
The Retailoop Dashboard
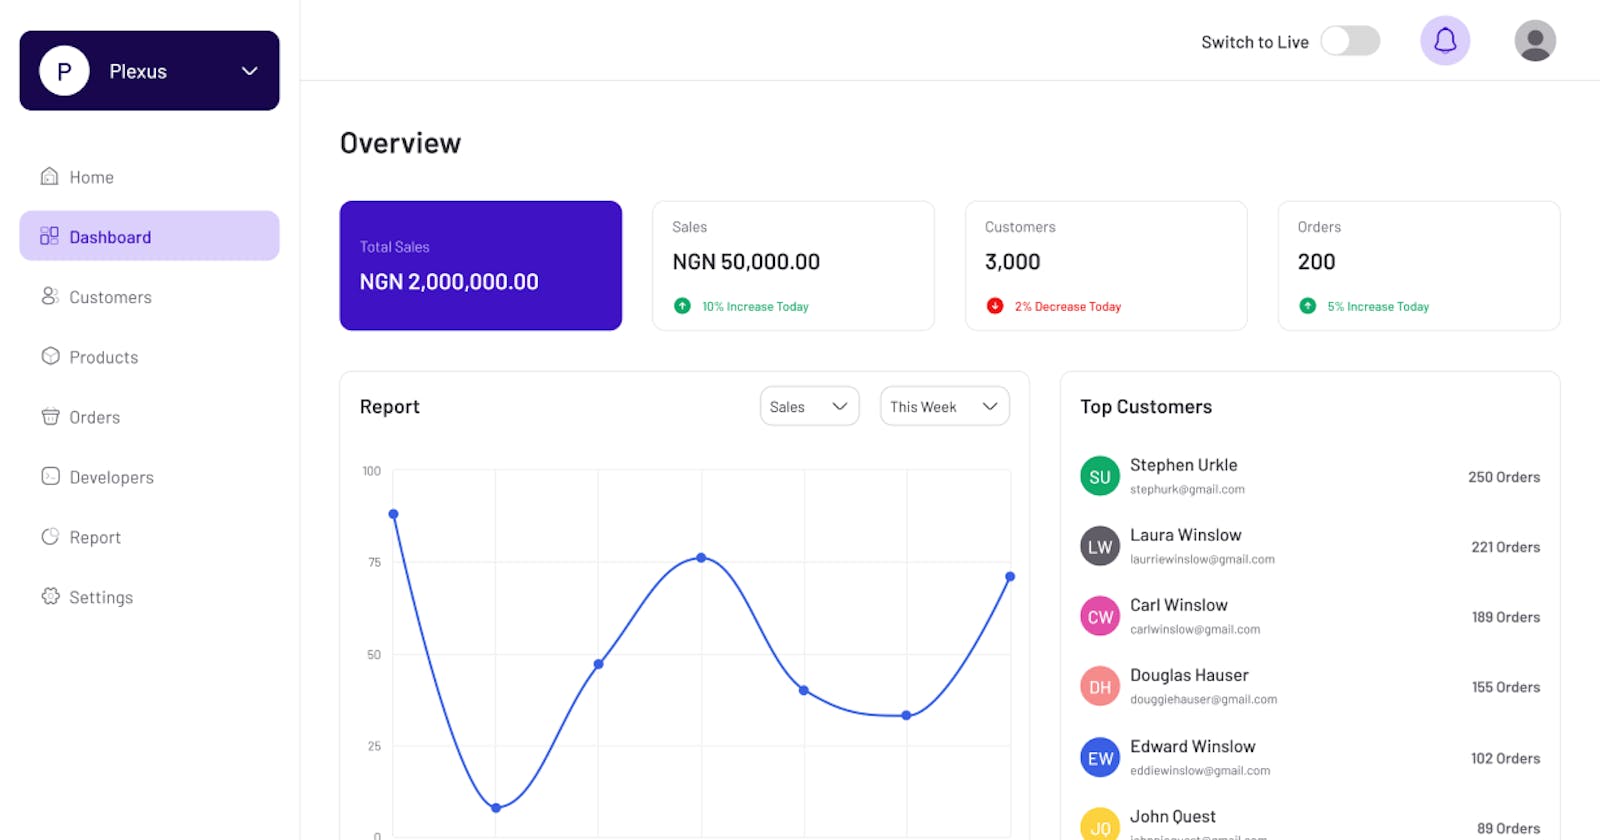
The Retailoop dashboard serves as a centralized hub that offers a detailed and thorough overview of your entire Retailoop account. It consolidates essential information such as the total sales, number of customers, and orders placed. Moreover, it incorporates comprehensive reports and prominently showcases the most valuable customers.
The primary objective of this dashboard is to furnish precise and up-to-date insights into the prevailing business trends and activities. By analyzing the data presented, individuals can obtain a comprehensive understanding of their business's performance and direction. Armed with this knowledge, they are empowered to make well-informed decisions that can positively impact both their immediate and long-term strategies. Whether it is determining the effectiveness of current marketing campaigns or assessing future growth opportunities, this dashboard acts as an invaluable tool for guiding business decisions and fostering success.
In Conclusion
The essence of the dashboard page lies in its ability to simplify complex data and present it in a meaningful, user-friendly way. By providing a real-time snapshot of critical data, dashboards empower individuals and organizations to make informed, data-driven decisions. As we continue to generate and rely on vast amounts of data, the importance of effective dashboard pages will only increase.